You’re looking to invest in the Singapore economy and wondering how you can do that relatively safely.
You find that the only exchange-traded funds (ETFs) that you can do it with are the SPDR STI ETF (ES3) and NikkoAM STI ETF (G3B).
But what’s the difference between them?
We compared both of them for you.
Continue reading.
SPDR STI ETF (ES3) vs NikkoAM STI ETF (G3B)
| SPDR (ES3) | NikkoAM (G3B) | |
| Launch date | 11th April 2002 | 24th January 2009 |
| Expense Ratio | 0.30% | 0.30% |
| Trustee | DBS Trustee Limited | HSBC Institutional Trust Services (Singapore) Limited |
| Stock Code | ES3 | G3B |
| Distribution Yield (Trailing 12-month period) | 2.48% | 3.12% |
| Last Dividend Payout Rate | S$0.083 | S$0.106 |
| Total Assets | S$1,664.09 million | S$613.54 million |
| Current NAV | S$3.34 | S$ 3.3652 |
| Dividend Distribution Frequency | Semi-annually | Semi-annually |
| Dividend Pay Date | February & August | January & July |
| Tracking error | 0.1934% – Rolling 1-Year tracking | 0.15% – 3-Year annualised |
Key Highlights as of 28 March 2022
Before we talk about the differences between the 2 ETFs, let us explain the similarities.
They both share the same objective of replicating before expenses the performance of the Straits Time Index (STI).
The STI is a globally-recognised underlying index and the main market benchmark for Singapore. It was started in 1966 and tracks the performance of the leading 30 companies on the Singapore Securities Exchange.
By consolidating stock indices, the STI follows FTSE’s approach. Additionally, it is designed to meet local and international investors’ investment needs.
The fund intends to invest all of its assets in shares in a similar proportion to the one reflected in the base index.
Therefore, you can participate in Singapore’s long-term growth in a single transaction, at an affordable cost.
Launch Date
SPDR STI ETF was launched in 2002 whereas NikkoAM STI ETF opened its doors much later in 2009.
Therefore, the SPDR STI ETF has a longer track record by virtue of having been around for close to 20 years.
However, since both have hit the 10-year mark, we can say that they are stable ETFs to invest your money in.
Fund Size
When you compare the 2 funds, SPDR STI ETF has a higher fund size at S$1,664.09 million, while NikkoAM STI ETF stands at S$613.54 million.
Even though a large asset base doesn’t necessarily mean good performance, it translates to higher liquidity or a high volume of trading.
In short, if you’re a trader, ES3 is better due to the higher liquidity. Conversely, passive investors shouldn’t care about either since you’re looking to hold it long term.
Expense Ratio
As an investor, you should put your money in a fund with the lowest charges so that your gains don’t get eroded both in the short term and long term.
Both funds have a 0.30% p.a expense ratio, which means that as an investor, it will cost you just $30 per every $10,000 worth of investment every year.
Since they’re the same, there’s not much to consider here.
Tracking Error
The tracking error for both funds reports the difference between a fund’s returns against the underlying index.
In this case, the SPDR STI ETF has a 0.1934% tracking error which represents a one-year rolling tracking error.
However, NikkoAM has a 0.15% which represents a 3-year annualised tracking error.
Overall, a lower tracking error is desirable, which gives G3B an advantage.
However, both ES3 and G3B report their errors in different manners, so it’s not an exact apple to apple comparison.
Regardless, we believe the tracking errors in both ETFs are negligible.
Dividend Yields and Distribution
Both funds pay dividends semi-annually while offering you an option of reinvesting them to increase the compound yield of your investment.
Both funds pay their dividends on different dates. For example, if you are an ES3 investor, you’ll get your dividends in February and August of each year.
By contrast, G3B pays dividends in January and July each year.
So if getting your dividends at a specific month is important, you can consider based on the dividend distribution periods.
Next, SPDR’s ES3 has a 2.73% dividend yield over a trailing 12 month period.
Conversely, the 12-month dividend yield for NikkoAM’s G3B is 2.88%.
Based on this data, the G3B provides better dividend yields.
ES3 vs G3B Performance Comparison
| Years | SPDR | NikkoAM |
| 1 year | 11.14% | 11.33% |
| 3 year | 5.75% | 5.68% |
| 5 Year | 4.88% | 4.79% |
| 10 Year | 4.52% | 4.49% |
As of 30 March 2022.
Comparatively, both ETFs delivered a lower performance than the benchmark over the 10 year period. However that is expected because the STI is a local barometer that tracks the current inflation rate and generally the entire Singapore economy.
However, in relative terms, the SPDR performs better than the NikkoAM fund for the 3, 5-year, and 10-year periods.
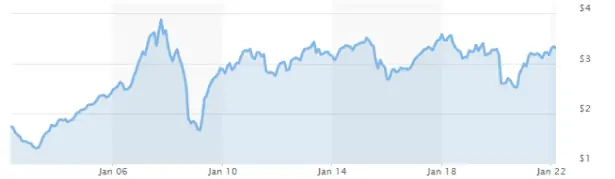
SPDR STI ETF NAV Performance Over a 5-Year Period
NikkoAM STI ETF NAV Performance Over a 5-Year Period
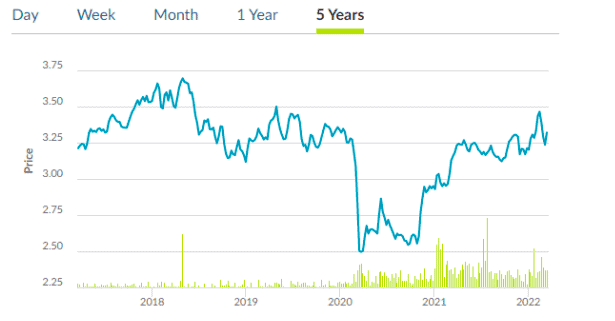
Over the past 5 years, the funds have maintained a consistent growth except in 2020 when there was a dip due to the effects on the economy caused by the COVID-19 pandemic.
Both have been rising steadily since the economy opened up in 2021 after the relaxation of the COVID-19 measures.
On the whole, both ETFs are pretty much the same as the investment returns you’ll receive are about the same on an annualised basis.
Also, they fit the bill if you’re looking for CPF investment options that can beat the 2.5% risk-free interest rate.
ES3 vs G3B: Portfolio Holdings
Because the 2 funds track the performance of the STI, you’ll notice that the portfolio holdings are similar to those in the base index.
| Company | Sector | ES3 | G3B |
| DBS Group Holdings Ltd | Financial | 19.69% | 19.7009% |
| Oversea-Chinese Banking Corporation Limited | Financial | 13.25% | 13.271% |
| United Overseas Bank Ltd. (Singapore) | Financial | 13.02% | 13.0257% |
| Singapore Telecommunications Limited | Telecommunications | 6.07% | 6.0609% |
| Jardine Matheson Holdings Limited | Industrials | 4.93% | 4.8913% |
| CapitaLand Integrated Commercial Trust | Real Estate | 3.29% | 3.351% |
| Ascendas Real Estate Investment Trust | Real Estate | 3.11% | 3.1114% |
| CapitaLand Investment Limited | Real Estate | 3.08% | 3.0667% |
| Wilmar International Limited | Consumer Staples | 3.07% | 3.0414% |
| Keppel Corporation Limited | Energy | 2.90& | 2.8945% |
Both ETFs have invested in some of the stable stocks of the economy in the Financials, Real Estate, Industrials, and Telecommunications.
Investment in the financial sector always promises better returns to investors, especially during inflation.
Typically, the interest rates rise during inflation and this is a good time for banks to make more money.
The industrial sector has shown resilience as the economy picks up from the effects caused by the pandemic.
The telecommunication sector is growing at unprecedented rates thanks to the digital transformation happening all over the world.
Many of these stocks are seen in our best Singapore blue-chip stocks list and even our best Singapore REITs list.
SPDR STI ETF vs NikkoAM STI ETF: Sector Breakdown
| Sector | SPDR STI ETF | NikkoAM STI ETF |
| Financials | 48.52% | 48.6% |
| Real Estate | 20.88% | 21.08% |
| Industrials | 9.19% | 15.22% |
| Telecommunication | 6.07% | 6.07% |
| Consumer Discretionary | 5.93% | 5.49% |
| Consumer Staples | 5.50% | 2.15% |
| Technology | 0% | 1.38% |
| Energy | 2.90% | 0% |
| Utilities | 0.76% | 0% |
The SPDR STI ETF offers a wide range of assets across many sectors.
From the figures, it’s evident that ES3 has invested heavily in the Financial sector as compared to other sectors. The fund has not made any investments in Technology.
From the figures, NikkoAM STI ETF has invested more in the Financial services sector followed by Real Estate, Industrials, and Telecommunications.
However, it fails to invest in Energy and Utilities.
As you can see, the SPDR STI ETF is more diversified in terms of sector allocation as compared to G3B.
However, the Tech sector is not in their allocations.
Despite so, both ES3 and G3B have shown similar returns regardless of their sector allocations.
I mean, if you’re looking to get full exposure to all sectors in Singapore, you can consider purchasing individual stocks to balance out your portfolio.
Here are some of our stock picks across different needs and industries:
You can read more of our stock picks here:
- 7 Best Energy Stocks in Singapore: Don’t Miss These Out!
- 7 Best Tech Stocks in Singapore: This Year’s Picks!
- 11 Best Healthcare Stocks in Singapore
- 5 Best Singapore Growth Stocks to Buy Now
- 11 Best Dividend Stocks in Singapore
- 7 Undervalued Stocks in Singapore
Conclusion
That’s it between the two!
Of course, both ETFs might not be available if you’re investing in them via a regular savings plans, so if that’s what you’re using, it really depends on what’s available!
Again, both are not as different as you might think. However, if you want to have the power of choice, then you’ll need to use something else.
That’s why we recommend you sign up for a online brokerage platform so that you can have your picks!
Psst, if you’re looking for the cheapest broker for SIngapore markets, it’s moomoo!
Need help investing?
We recommend you engage a financial advisor instead.