
Whether you’re looking for stable income or ready access to capital gains, investing in stocks is a great way to generate cash flow that can last a lifetime.
And if value investing is a strategy you’re adopting, searching for undervalued stocks is definitely part of your research.
Here are 7 undervalued stocks in Singapore we’ve identified.
- Jardine Cycle & Carriage Ltd
- Keppel Corporation
- Citi Developments Limited
- HongKong Land Holdings Ltd
- UOL Group Limited
- CapitaLand
- Yangzijiang Shipbuilding Holdings Ltd
| Stock Name | Ticker | Stock Price | Price-to-Book Ratio(P/B) | Dividend Yield |
| Jardine Cycle & Carriage Ltd | SGX: C07 | $21.18 | 0.86 | 3.30 % |
| Keppel Corporation | SGX: BN4 | $5.90 | 0.80 | 5.59% |
| City Developments Limited | SGX: C09 | $7.14 | 0.88 | 0.98% |
| HongKong Land Holdings Ltd | SGX: H78 | $5.59 | 0.37 | 3.99% |
| UOL Group Limited | SGX: U14 | $7.26 | 0.601 | 4.18% |
| CapitaLand | SGX: C31 | 3.48 | 0.8299 | 5.18% |
| Yangzijiang Shipbuilding Holdings Ltd | SGX: BS6 | 1.32 | 0.7 | 3.41% |
1. Jardine Cycle & Carriage Ltd (SGX: C07)
Jardine Cycle & Carriage is a conglomerate that aims to expand within the region through investments in top businesses leaning towards new consumer trends and urbanisation.
This diversified company has stakes in Siam City Cement (from Thailand), Vinamilk (a Vietnamese company), and Astra International, one of Indonesia’s largest motor vehicle companies.
Jardine Matheson Holdings Ltd (SGX: J36) owns 75% of the company.
Here is a highlight of the company’s performance over the last five years.
| Year | 2017 | 2018 | 2019 | 2020 | Half-year 2021 |
| Revenue ($ million) | 17,336.7 | 18,991.8 | 18,591 | 13,234 | 8,287 |
| Underlying net profit attributable to shareholders
($ million) |
769.5 | 856.0 | 881 | 540 | 226 |
| Earnings per share($ cents) | 195 | 217 | 218 | 109 | 88 |
| Gearing | – | – | 9% | 13% | – |
| Dividend payout ratio | 44% | 40% | 40% | n/a | – |
Values from Jardine Cycle & Carriage annual reports.
Revenues, underlying profit and earnings per share have been on an upward trend up to 2019 but taking a dive in 2020.
As well, no dividends were proposed for the year 2020 which could be attributed to the devastating effects of the COVID-19 pandemic that affected stock markets globally.
However, the corporation’s earnings recovered in the first half of 2021.
It should be noted that the net debt at the end of 2020 increased to USD$4.6 billion from USD3.6 billion at the end of 2019. As well, the net gearing ratio increased to 13% from 9% at the end of 2019.
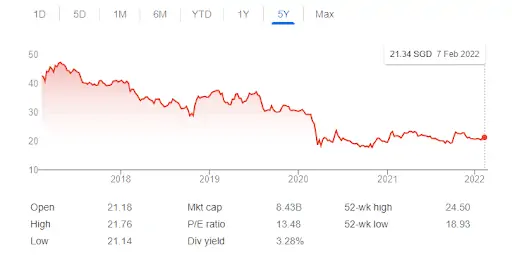
From the chart, there hasn’t been a significant increase in the share price for the last five years. Despite the decrease, the PB is 0.86 indicating that the stock is potentially undervalued.
In my opinion, because the company mainly relies on Indonesia’s automotive industry, it can bring some investment risk due to a lack of diversification.
Despite this, the JC&C share is still a worth buy mainly due to the dividend payout of 3.30%.
Currently, when you compare to other bluechip companies, it’s among the top 10.
Besides, we are seeing an increase in profits in the first half of 2021.
2. Keppel Corporation (SGX: BN4)
Founded in 1968, Keppel Corporation Ltd is a blue-chip company on the Straits Time Index.
As a conglomerate, Keppel Corporation’s main line of business include; Investments, Property, Offshore & Marine, and Infrastructure.
The Offshore and Marine division is tasked with construction, repair, ship applications such as conversions and repair and shipbuilding. Its operations extend beyond Singapore to include the US and Brazil.
The Property division operates in Vietnam, Singapore, Indonesia, and China.
On the other hand, the Infrastructure segment operates in the UK, Singapore, Qatar, and China.
Further, the Investment division consists of Keppel Capital which is the asset management segment that also manages Singapore’s top REITs, including;
- Keppel REIT (SGX: K71U)
- Keppel Pacific Oak US REIT (SGX: CMOU)
- Keppel DC REIT (SGX: AJBU)
- Keppel Infrastructure Trust (SGX: A7RU)
Here is a summary of Keppel Corporation five year performance
| Year | 2017 | 2018 | 2019 | 2020 | 2021 |
| Revenue($ million) | 5964 | 5965 | 7580 | 6574 | 7069 |
| Net profit
($ million) |
217 | 948 | 707 | -506 | 1020 |
| Earnings per share ($ cents) | 0.46 | 0.48 | 0.85 | – | 0.56 |
| Dividend per share ($ cents) | 22 | 30 | 20 | – | – |
The period from 2014 saw a decline in the revenues and Return on Equity (ROE) attributed to poor performance in the Offshore & Marine segment occasioned by fluctuations in the oil market.
However, this picked up from 2017 to 2019 before getting worse with the onset of the COVID-19 pandemic in 2020.
Subsequently, this saw the conglomerate register a net loss of $506 million in the first half of 2020.
Keppel posted an impressive $1.02 billion net profit which is a notable turnaround from the net loss of 2020.
The current earnings per share stands at 0.56 which is lower than the 0.85 released in 2019.
Share price performance
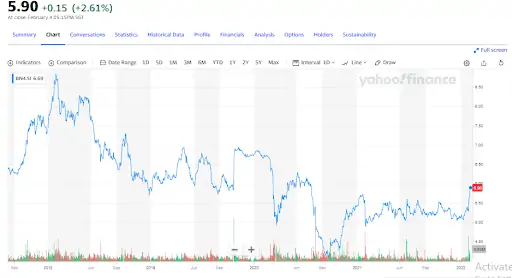
The share price has been on a downward trend over the years with major fluctuations in between the months. As well the dividend payout has been on the decline alongside the decreasing net profit.
For the first half of 2022, the company declared an interim dividend per share of 3.0 Singapore cents down from 8.0 the previous year.
It’s good to note that the P/B ratio of Keppel Corporation is 0.88, slightly lower than the historical average of 1.
Therefore, this indicates that the share is potentially undervalued.
3. City Developments Limited (SGX: C09)
City Developments Limited is one of Singapore’s largest corporations with a wide network covering 29 countries and 106 locations.
The giant has stakes in hotels, residences, apartments, offices, and shopping malls.
In terms of geographical allocation, 48% of the business is from Singapore, 16% US, 13% UK, 4% from China, and 22% from other countries.
In addition, the firm has invested in IREIT Global (SGX: UD1U) and CDL Hospitality Trusts (SGX: J85) which are 2 of Singapore’s listed REITs.
Here is a summary of City Developments performance in the past five years.
| Year | 2020 | 2019 | 2018 | 2017 | 2016 |
| Annual Revenues($ millions) | 1529 | 2514 | 3130 | 2775 | 2829 |
| EBIT($ millions) | -618 | 479 | 670 | 579 | 669 |
| EPS | -1.54 | 0.43 | 0.43 | 0.41 | 0.50 |
Figures from City Developments annual reports.
There was a decline in profits from 2018 to 2020 with the company registering a net loss of -$618 million in 2020.
In addition, the EPS was stable from 2017 to 2019 at 0.43. However, it registered a negative in 2020 mainly due to a decline in profits. With a P/B ratio of 0.88, the shares are undervalued.
One main risk to the company’s investment is the COVID-19 pandemic of 2020 which affected the overall revenue from hotels and property investments.
Also, Singapore’s private properties market had a slow uptake in 2018 mainly because of cooling measures of July 2018.
Equally, the share has performed poorly in the last five years as shown in the table below.
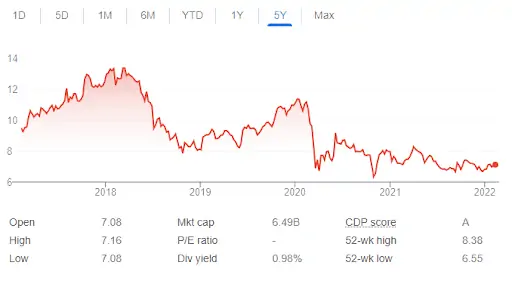
Fortunately, the revenues are expected to increase in the future with the relaxation of measures introduced due to the COVID-19 pandemic.
Also, the economy is on a recovery path with the overall effect being felt in all sectors.
4. Hongkong Land Holdings Ltd (SGX: H78)
Hongkong Land Holdings Ltd was started in 1889 and is a property investment management company with holdings in several Asian countries and cities including, Hong Kong, Jakarta, Singapore, and China. Additionally, it’s also under Jardine Matheson Holdings Ltd (SGX: J36).
In Singapore, the company has invested in One Raffles Link, Marina Bay Financial Centre, and One Raffles Quay.
Its revenue mainly comes from property sales, service, and rental income. In addition, the Land Business division comprises investment and development properties.
Here is a summary of Hongkong Land Holdings Ltd performance in the past 5 years.
| 2020 | 2019 | 2018 | 2017 | 2016 | |
| Revenue($ million) | 2094 | 2320 | 2665 | 1616 | 1994 |
| EBIT($ million) | -2483 | 350 | 2332 | 5608 | 3522 |
| EPS | -5.67 | 0.42 | 5.25 | 11.93 | 7.11 |
Declining property sales has affected the company’s revenues which have grown at a slower rate. For example, in 2018, the company had a $2665.4 million revenue, while in 2019, it took a dip to $2320 million.
The company’s book value per share grew at -4.30% in 2021 and in the first quarter of 2021, it was $14.75.
Before the COVID-19 pandemic of 2020, the share price declined, as shown in the table below, but has been picking steadily though at a lower rate.
However, with a PB is at 0.37, meaning that the shares are currently undervalued.
The main risk of Hongkong Land Holdings Ltd shares is the geographical allocation whereby most of its holdings are in Hongkong.
Particularly, in Hongkong’s the property prices are expected to take a dip as most people opt to stay out of towns.
In addition, property prices have been stagnating over the last three years.
5. UOL Group Limited (SGX: U14)
UOL Group Ltd is a Singapore company listed in the Straits Times Index. Its share price is currently at S$7.26 and the (P/B) ratio is 0.601 which gives an impression that is undervalued.
The company has been around for over 50 years with stakes in hotels, the service industry, investment and development properties.
In addition, the Pan Pacific Hotels Group Ltd is a subsidiary of this conglomerate with stakes in Park Royal, Pan Pacific, and Park Royal brands.
The holdings also include other assets held by United Industrial Corporation Ltd (UIC) alongside Marina Square, Clifford Centre, and Novena Square.
In a nutshell, UOL’s main portfolio is property management, investment, property investments, hotel operations, management services, and technologies.
Here is a summary of UOL’s Group Ltd 5 years performance.
| 2020 | 2019 | 2018 | 2017 | 2016 | |
| Revenue | 1977 | 2283 | 2397 | 2114 | 1441 |
| Net Profit attributable to shareholders | 13 | 478 | 418 | 880 | 287 |
| EPS | 1.56 | 56.79 | 49.7 | 107.5 | 35.8 |
UOL’s revenues and profits have been on an upward trend in 2015 and 2016. However, there was a decline in 2017, 2018, 2019, and 2020. The gearing ratio has been consistent and leveraged 0.3 at the close of 2019.
The main risk of UOL shares is the lack of wider geographical spread. Although Singapore’s contribution to total revenue is 70% the rest of the revenue share is spread amongst 13 countries including China.
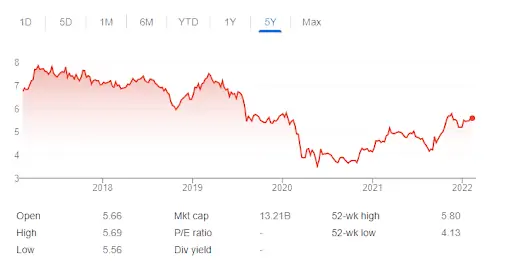
There have been fluctuations in the share prices as shown in the table below.
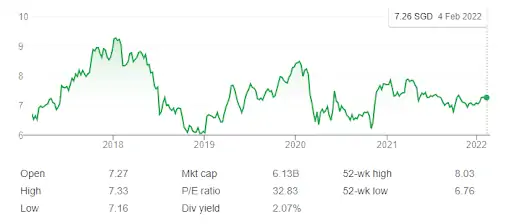
With a P/B ratio of 0.601, the share is potentially undervalued.
6. CapitaLand (SGX: C31)
CapitaLand is one of the largest real estate companies in Asia and a part of the Straits Times Index. In addition, it has stakes in several REITs listed in Singapore Exchange (SGX).
Examples of REITs include; Ascendas Real Investment Trust (SGX: A17U), CapitaLand Commercial Trust (SGX: C61U), and CapitaLand Mall Trust (SGX: C38U).
Here is a summary of CapitaLand’s 5-year performance.
| Year | 2021 | 2020 | 2019 | 2018 | 2017 |
| Revenue (S$ million) | 2730 | 6533 | 6235 | 5602 | 4618 |
| Profits attributable to shareholders
(S$ million) |
922 | -1574 | 2136 | 1763 | 1570 |
| Earnings per share (Singapore cents) | 17.7 | -31 | 46.4 | 42.1 | 37.0 |
| Dividends per share(Singapore cents) | – | – | 3.9 | 3.5 | 3.1 |
The company has had a positive climb in its revenues between 2014 and 2019 mainly attributed to a growth in shareholder’s capital.
In addition, the dividend per share has been consistent over the years except 2020-2021 when it registered a negative 25% growth rate.
The main risk for the CapitaLand shares is a slowdown in the economies of Singapore and China caused by the 2020’s COVID-19 pandemic.
This has had a significant impact on the performance of many businesses including CapitaLand.
As well, the share prices have had fluctuations over the years as shown below.
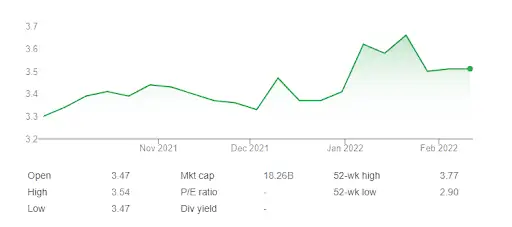
Notably, CapitaLand shares were suspended from trading from 9.00 am Sept 10, 2021.
CapitaLand’s future plans include spinning off the CapitalLand Investment division as CapitalLand Investment Management (CLIM) to be listed on the Singapore Stock Exchange.
The future is bright for the investors as the spin-off will create worldwide REIM with a presence in over 30 countries.
It will also scale up the revenues and shareholders can expect higher EPS in the future.
7. Yangzijiang Shipbuilding Holdings Ltd (SGX: BS6)
Yangzijiang Shipbuilding Holdings Ltd has been around since 1956. It’s one of the biggest private shipbuilding companies globally with major stakes in China.
The company has 5 major shipyards along the Yangtze River in Jiangsu Province of China. The yards are makers of large commercial vessels such as bulk carriers, liquefied natural gas and large containerships.
Other countries where it operates include Canada, Taiwan, Greece, Korea, Germany, and Norway. Customers are spread far and wide around the world including Europe and North America.
Most of the company’s revenues are from investments and shipbuilding which holds a larger stake.
Here is a summary of Yangzijiang Shipbuilding Holdings Ltd 5 year performance.
| 2016 | 2017 | 2018 | 2019 | 2020 | |
| Revenue
(RMB ’000’) |
15,089,438 | 19,205,596 | 23,238,289 | 23,579,175 | 14,841,266 |
| Net Profit
(RMB ’000’) |
1,998,943 | 2,848,483 | 3,070,345 | 3,105,069 | 2,516,404 |
| ROE | 8.5% | 12.1% | 13.2% | 10.4% | 7.9% |
From 2016 to 2020, the company’s revenue declined to RMB 14.8 billion from a high of RMB 15.1 billion. However, the net profit rose to RMB 2.5 billion from RMB 2.0 billion which means the company has been able to control the costs pretty well.
The 2020 COVID-19 pandemic had an overall effect on the shipping industry.
As well, the earnings per share have had a dip in 2020 due to the COVID-19 pandemic before rising slowly in 2021.
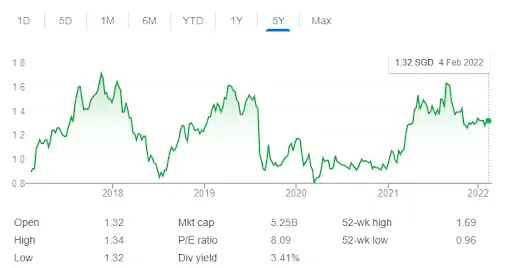
Additionally, the PB ratio of 0.7x corresponds to Singapore’s Machinery Industry average which is at 0.8.
The main risk analysis of this company is the unstable dividend track record which has shown fluctuations over the years.
This has led to lower dividend payments over the past 10 years.
In addition, there has been significant inside selling in 2021 and 2022 with the latest transaction taking place on 24 January 2022.
Another risk is the cyclical nature of the commercial building industry which can affect the future demand for vessels.
Also, because the market is worldwide, global factors can affect the shipping industry in a big way.
Conclusion
In summary, the 7 companies highlighted here offer attractive valuations at current market prices. However, all of these companies also possess strong growth potential.
Their competitive advantage or differentiation lies in their unique product offerings, leading to high customer demand.
Therefore, investors who hold long positions should expect to receive substantial returns over the coming years. These investments will deliver solid cash flow dividends that should continue to grow.
Looking to purchase these stocks?
Our preferred brokerage is moomoo, and with good reason.
However, you can also check out our best brokerage accounts in Singapore guide if you prefer other selections.
But if you need help in investing, you should always get help from a financial advisor.