
Interested to invest in tech ETFs and comparing both ARKK and QQQ?
We’ve got you.
In this post, we compared both ARKK and QQQ so that you can make the best decision for yourself.
Read on.
Key Highlights as of 4 April 2022
| ETF | ARKK | QQQ |
| Issuer | ARK | Invesco |
| Current NAV | $65.67 | $369.21 |
| Inception Date | 31 October 2014 | 10 March 1999 |
| Expense Ratio | 0.75% | 0.2% |
| Assets Under Management (AUM) | $113 billion | $200.78 billion |
| Average Spread | 0.03% | 0.00% |
| P/E Ratio | -35.32 | 32.37 |
| P/B Ratio | 3.64 | 8.43 |
| Distribution Yield | 1.17% | 0.48% |
| Underlying Index | Not available | Nasdaq-100 Index. |
About
ARKK and QQQ are two popular ETFs offered by ARK Invest and Invesco companies respectively.
ARK invests its assets in companies whose growth objective is disruptive innovation. These are fast-growing companies specialising in next-gen technologies, fintech, cryptocurrencies, genomic revolution, artificial intelligence, and energy storage.
These investments are appealing since the world is moving towards digital revolution.
The QQQ is a passively-managed ETF that tracks the performance of the Nasdaq-100 Index which comprises top 100 and most-actively traded stocks on the Nasdaq. It’s important to note that this excludes non-financial stocks.
However, the Invesco QQQ tracks fewer stocks since the Nasdaq Composite Index tracks all the stocks on the Nasdaq including finance-related sectors.
The Nasdaq-100 Index strategy is to use specific weights of items depending on the AUM. What it means is that it uses the weighting method by reviewing and adjusting the composition of the index every quarter.
Initially, it was trading under the ticker code QQQQ, however, it dropped one Q after acquisition from Invesco and PowerShare. Nonetheless, the change didn’t affect its mode of operation.
The fund provides exposure to firms whose main operations include transformative and technological themes like;
- Augmented Reality
- Cloud Computing
- Big Data
- Mobile Payments
- Streaming Services
- Electric Services
- Electric Vehicles
Therefore, QQQ is an excellent choice for an investor who is bullish on large-cap technology companies.
Market Capitalisation
As you would expect, QQQ has more assets under its management since its an older fund having been launched on 03/10/1999.
Currently,the NAV stands at $369.21 to deliver a market cap of $200.78 billion.
By contrast, ARKK has been around since 31st October 2014 and has amassed $113 billion in assets. Its NAV is presently at $65.67.
Expense Ratio
The ARKK has an expense ratio of 0.75% whereas the QQQ stands at 0.2%. As you can see, ARKK is more expensive as compared to QQQ.
Without a doubt, a difference of 0.55% is quite significant while looking at long term investment.
It’s important to pay key attention to a fund’s expense ratio. Normally a lower expense ratio produces more favourable results assuming other factors remain constant.
A higher expense ratio may eat in your investments.
Obviously, QQQ is a cheaper ETF thanks to lower costs. However, if your fund manager is generating (much) higher returns on ARKK, then the issue of cost shouldn’t be a problem.
Dividend Payments
Both ETFs distribute profits or dividends to investors.
ARKK pays its dividends annually and had a distribution yield of 1.17% of a trailing 12-month period.
On the contrary, QQQ pays quarterly dividends and had a distribution yield of 0.48% over a trailing 12-month period.
ARKK Vs QQQ: Holdings
Company Holdings
ARKK has about 42 stocks which is a small figure when compared to other funds. By contrast, QQQ has 102 holdings.
Generally, investing in a fund with more stocks means spreading your risks and diversifying your portfolio.
In this case, QQQ would be a better option if you’re looking for something of lower risk.
The QQQ holdings mainly comprise bluechip companies in the tech sector except financial firms such as banks.
The QQQ sector allocation is extremely tech-related with over 50% of its assets allocated to tech-sector.
For this reason, the top 10 company holdings are popular tech giants such as Apple, Microsoft and Meta (formerly Facebook).
Looking at individual holdings for ARKK, the fund has invested mostly in IT and Health which shows that there’s diversity in different industries.
| Company | ARKK Percentage | Company | QQQ Percentage |
| Tesla | 10.45% | Apple Inc | 12.49% |
| Teladoc Health | 6.64% | Microsoft Corp | 10.13% |
| Roku | 6.28% | Amazon.com Inc | 7.35% |
| Zoom | 6.15% | Tesla Inc | 5.08% |
| Block | 5.93% | NVIDIA Corp | 4.13% |
| Coinbase Global | 5.71% | Alphabet Inc Class C | 3.89% |
| Exact Sciences Corporation | 4.72% | Alphabet Inc Class A | 3.69% |
| Unity Software | 4.71% | Meta Platforms Inc Class A | 3.47% |
| Twilio | 4.18% | Broadcom Inc | 1.85% |
| UiPath | 3.99% | Costco Wholesale Corp | 1.81% |
| Total | 58.76% | Total | 53.89% |
Sector Allocations
Both funds’ ETFs holdings are widespread among different sectors and industries. The following are sector allocations as of December 31, 2021.
| Sector Breakdown | ARKK Percentage | QQQ Percentage |
| Information Technology | 33.2% | 50.97% |
| Healthcare | 32.2% | 5.66% |
| Communication Services | 15.8% | 18.38% |
| Consumer Discretionary | 10.7% | 16.13% |
| Consumer Staples | – | 5.14% |
| Financials | 6.5% | – |
| Industrials | 1.5% | 3.65% |
| Non-classified | 0.1% | 0.06% |
| Total | 100% | 99.99% |
Geographical Spread
In terms of geographical allocation, both ETFs are mainly concentrated in the US. The distribution for QQQ includes; US 97.7%, Asia Emerging and Eurozone 0.8%, Latin America 0.4%, and UK 0.3%.
On the other hand, the geographical spread of ARKK includes, USA 99.32%, Singapore 0.08%, and Belgium 0.60%.
ARKK vs QQQ: Historical Returns
Even though it has no benchmarking index, the ARKK has had outstanding results and consistently outperformed the S&P 500 for a five year period.
| 1 Year | 3 Years | 5 Years | Since inception | |
| ARKK | -43.189% | 14.413% | 24.675% | 19.05% |
| S&P500 | 15.65% | 18.92% | 15.99% | 7.62% |
| QQQ | 13.95% | 27.04% | 23.16% | 9.55% |
| Nasdaq-100 Index | 14.14% | 27.30% | 23.41% | 9.78% |
Source: Invesco and ARKK, accurate as of 2 April 2022
Investor QQQ performance over the last 10 years
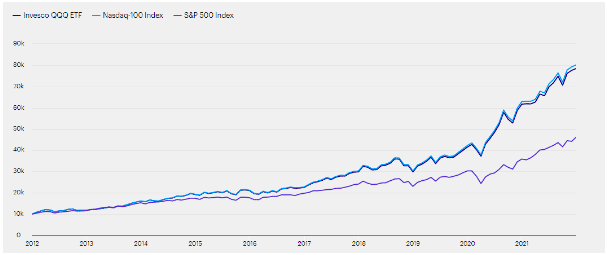
Figures as of 31st December 2021
QQQ, has shown stable results and has performed at par with the Nasdaq-100 index over a 10 year period. It has also outsmarted the S&P500.
Because of the remarkable performance, it’s one of the most popular ETFs amongst long-term investors and ranked as one of the best US ETFs.
Comparing the performance of both ETFs
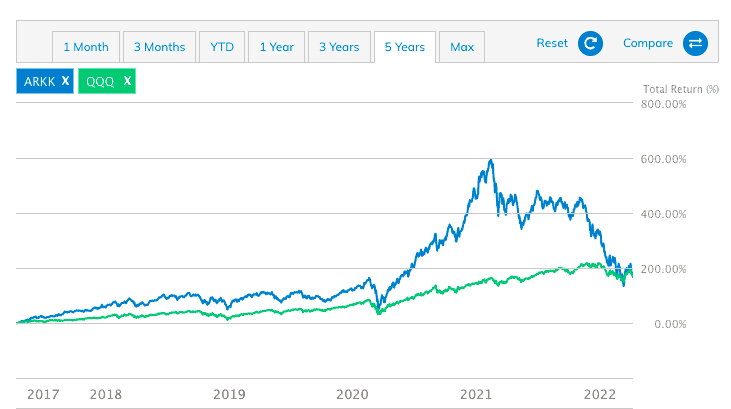
QQQ is the oldest, thus it has had a prolonged period of stellar performance. As you can see from the chart, there has been a rise in the NAV from 2016 before experiencing a slight dip in 2020 due to the impact caused by COVID-19 pandemic.
Fortunately, both funds registered high performances in 2021 since the US economy opened up after the relaxation of COVID-19 measures.
Even though both funds peaked in 2021, its evident that ARKK has shown stellar performance as compared to the QQQ over the last five years.
However, it’s (much) more volatile due to the recent market conditions caused by soaring inflation rates and the global environment.
MSCI ESG Fund Rating
The MSCI ESG Fund Rating gauges how portfolios are performing against risks, opportunities, social, economic, political, and governance factors.
This is one of the core factors to look at if you’re ESG investing.
The best rating is AAA, whereas the worst is CCC.
Invesco QQQ Trust has an MSCI ESG Fund Rating of AA based on a score of 7.70 out of 10.
On the other hand, ARKK has an MSCI ESG Fund Rating of A based on a score of 6.50 out of 10.
Conclusion
Now that you know the differences between both ARKK and QQQ, the decision comes to which should you choose.
I think this part depends on the type of investor you are and your time horizon as an investor.
If you have a high-risk tolerance and have a long time horizon, the ARKK might be better for you as there’s lesser diversification provided in the ETF with only 42 stocks in its holdings.
With lesser diversification means more volatility. You can see this above where ARKK dropped more than 60% from its all-time high. However, it also performed almost 200% better than QQQ at its peak.
Furthermore, ARKK is looking to invest in companies that are disruptive in nature.
This means that it will take time for technologies to develop and for adoption to take place.
This would mean that the companies Cathie Wood picked are likely to disrupt the industries they’re in further down the line.
Therefore, you’ll need to have a longer time horizon to fully reap your returns.
However, if you have a shorter time horizon or have lower risk tolerance, the QQQ is better for you.
With a low expense ratio of 0.2%, high diversification, and returns that outperform the S&P500, there’s much to like about the QQQ.
In fact, I personally hold the QQQ in my portfolio instead of ARKK despite being more risk-averse and having a long time horizon.
Interested to get these ETFs?
Our preferred trading broker is moomoo as they offer free trades in the US markets until April 2023 and only US$0.99/trade thereafter.
If you’re an investor, Syfe Trade offers free monthly trades in the US markets as well. Check out Syfe here.
Need help investing?
Many of our readers are flocking to get investing help from our partner financial advisors!
References
- https://money.usnews.com/funds/etfs/large-growth/invesco-qqq-trust/qqq
- https://www.etf.com/QQQ
- https://finance.yahoo.com/news/invesco-qqq-qqq-investing-radar-102010947.html
- https://secure.fundsupermart.com/fsm/stocks/etf-factsheet/NASDAQ/QQQ
- https://www.invesco.com/qqq-etf/en/about.html
- https://secure.fundsupermart.com/fsm/stocks/etf-factsheet/NYSE/ARKK