The stock market has seen some incredible gains over the last decade. In fact, the S&P 500 index has risen from 1,300 at the start of 2000 to nearly 4,200 today.
This growth has been fueled by technological advancements and innovations in computing, communications, and consumer electronics.
Because of this, investors are flocking to tech companies due to the potential growth prospects they proved.
Wondering what the best tech ETFs to do so are?
Here’s where we’re here to help.
7 Best Tech ETFs for Singapore Investors
| ETF | What it Tracks | Expense Ratio |
| Invesco QQQ ETF | Nasdaq-100 Index | 0.20% |
| Technology Select Sector SPDR Fund (XLK) | Technology Select Sector Index | 0.10% |
| Vanguard Information Technology ETF (VGT) | MSCI US Investable Market Index | 0.10% |
| First Trust Dow Jones Internet Index ETF (FDN) | First Trust Dow Jones Internet Index ETF(FDN) | 0.51% |
| SPDR S&P Software & Services ETF | S&P Software & Services Select Industry | 0.35% |
| iShares Global Tech ETF (IXN) | Global 1200 information Technology Sector Index | 0.43% |
| KraneShares CSI China Internet ETF (KWEB) | CSI Overseas China Internet Index. | 0.70% |
1. Invesco QQQ ETF (QQQ)
The Invesco QQQ ETF is benchmarked to the Nasdaq-100 which comprises the top 100 companies on the Nasdaq exchange.
From an investor’s viewpoint, the fund currently has one of the lowest expense ratios at 0.2%. It has a market cap of $181.963 billion worth of assets.
Exposing investors to top 100 firms, the QQQ is also one of the most favourite tech ETFs as it’s expansive and provides a good exposure into the tech industry.
The QQQ’s Net Average Value (NAV) had a slight decline in 2020 before climbing in 2022, primarily due to the effects caused by the COVID-19 pandemic.
Currently, the economy is still recovering, and long-term growth prospects are optimistic due to unemployment levels falling. More spending is also expected in the economy once inflation fears die down.
Looking at the performance of the QQQ, the consumer staples and the ICT sector were the top-performing in 2021.
In short, you will want to put your money in sectors that are disruptive to people’s ways of doing things such as 5G, artificial intelligence (AI), Internet of Things, and cloud computing.
Without a doubt, these hold the most significant growth potential.
Therefore, Invesco QQQ ETF may be the best fund for this kind of environment simply because it has good exposure.
Here is the sector allocation for Invesco QQQ.
| Sector | Invesco QQQ |
| Information Technology | 50.78% |
| Communication Services | 17.73% |
| Consumer Disc | 16.8% |
| Health care | 5.97% |
| Consumer staples | 4.99% |
| Industrials | 2.67% |
| Utilities | 0.88% |
Figures from Bloomberg, L.P
As you can see, Invesco QQQ ETF is leaning towards the IT and communication services sectors which hold greater growth potential.
Recently, 6 major companies joined the base index (Nasdaq 100), as shown below.
| Company | Sector |
| Airbnb | Travel and Bookings |
| Zscaler, Fortinet, and Palo Alto Networks | Cybersecurity |
| Lucid Group | Electrical Vehicle Manufacturing |
| Datadog | Data Management & Cloud Computing |
Read:
2. Technology Select Sector SPDR Fund (XLK)
The Technology Select Sector SPDR Fund is one of the most sought-after tech ETFs in the US and the world in general. It’s tied to stocks that are found in the S&P500.
The fund seeks the performance of publicly-traded securities in the Technology Select Sector Index by employing a replication approach.
The XLK invests at least 95% of its portfolio in securities in the reference index in the same proportions.
The ETF was established in 1998 and has grown to a massive size of $50 billion NAV. As well, it has maintained a low expense ratio of 0.10%.
Some of the notable names include old guards such as;
- Microsoft Corp (MSFT)
- Apple Inc. (AAPL).
- NVIDIA Corp (NVDA)
- Visa Inc – Ordinary Shares – Class A V
- Mastercard Incorporated – Ordinary Shares – Class A MA
- Broadcom Inc (AVGO)
- Cisco Systems, Inc. (CSCO)
- Adobe Inc (ADBE)
- Salesforce.Com Inc (CRM)
- Accenture plc – Ordinary Shares – Class A (ACN)
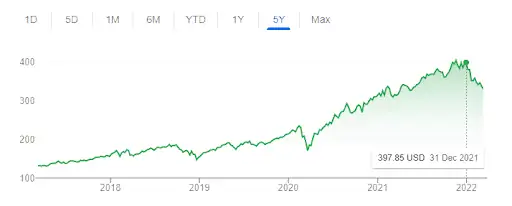
Performance of the Technology Select Sector SPDR Fund Over The Last 5
Years
From the chart, the fund’s NAV has been rising steadily since 2020 and registered an all-time high of $174.88 in December 2021.
Geographical Spread of Technology Select Sector SPDR Fund
| Region | Percentage |
| Asia Developed | 0.2% |
| US | 99.3% |
| Euro Zone | 0.5% |
Sector Weightings of Technology Select Sector SPDR Fund
| Sector | Percentage |
| Technology | 90.66% |
| Financial Services | 7.7% |
| Industrials | 1.64% |
| Total | 100% |
As you can see the bulk of the investment is in the technology sector.
However, this ETF isn’t as diversified as the QQQ, but has similar long-term performances across various periods.
I personally prefer the QQQ, but this is still one of the best tech ETFs out there.
3. Vanguard Information Technology ETF (VGT)
Suffice to say, Vanguard Information Technology ETF (VGT) is heavily weighted towards large-cap tech stocks. Indeed at least half of its portfolio is in the top 10 positions for companies with a diversified outlook.
The top 10 companies that comprise the VGT includes;
- Apple Inc.
- Microsoft Corp.
- NVidia Corp.
- Visa Inc.
- Mastercard Inc.
- PayPal Holdings Inc.
- Adobe Inc.
- Intel Corp.
- Cisco Systems Inc.
- Salesforce.com Inc.
Vanguard Information Technology ETF adopts an indexing strategy that tracks the investment results of the MSCI US Investable Market Index which comprises large, mid, and small-cap US companies within the IT sector.
Like Vanguard, investors can expect exposure at low prices. The fund has an asset portfolio of $45 billion and a rock-bottom expense ratio of 0.1%.
Encouragingly, onwards as we head into the future, there’s some level of optimism crawling back into the tech sector. The prospects are happening across the board in channel firms, distributors, or even vendors.
As an investor, this is the best time to bet on your hard-earned cash as expanded opportunities mean more returns. There’s no doubt that the VGT will be one of the most sought-after funds out there.
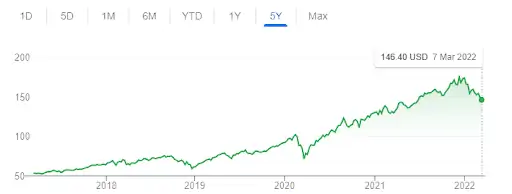
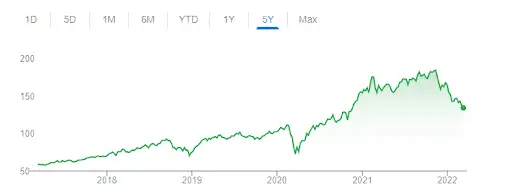
Performance of the Vanguard Information Technology Over The Last 5 Years
If you’re looking for an ETF with massive growth prospects, you can consider the VGT.
Whereas some investors will go for the S&P500 index, as a risk mitigation measure, it’s worth noting that the Vanguard Information Technology ETF has generated impressive returns since it mainly focuses on tech companies.
Therefore, one may not dismiss this factor and there’s every reason to believe that tech companies will dominate the market going forward.
In terms of industry specifics, the company has the following sector weightings.
| Sector | Allocation |
| Technology | 90.92% |
| Financial Services | 7.2% |
| Industrials | 1.48% |
| Communication Services | 0.34% |
| Healthcare | 0.05% |
Here is the geographical spread of Vanguard Information Technology ETF
| Region | Allocation |
| United States | 99.2% |
| Asia Emerging | 0.5% |
| Asia Developed | 0.3% |
4. First Trust Dow Jones Internet Index ETF (FDN)
The First Trust Dow Jones Internet Index ETF is still a force to reckon with as it has up to $10 billion in assets.
The index tracks the performance of the Dow Jones Internet Composite Index comprising of
top internet-related companies in the US that have ranked high in terms of growth.
Its expense ratio is at 0.51%, which is pretty reasonable though not as low as other options in this list.
Some of the big names in the list include;
- Amazon.com Inc
- Netflix Inc
- Saleforce.com.
- Alphabet Inc
- Cisco Systems Inc
- Meta Platforms Inc
- Paypal Holdings
- Airbnb
- Workday Inc
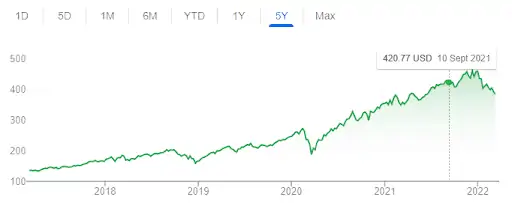
Performance of the First Trust Dow Jones Internet Index ETF Over The Last 5 Years.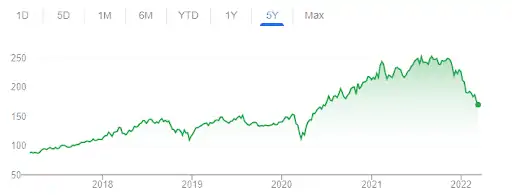
The fund’s NAV has had an erratic performance over the last 5 years. Looking at the chart, there was minimal growth between 2018 to 2020. Like most ETFs, there was a decline in 2020 due to the effects of the pandemic.
Fortunately, the fund registered positive gains in 2020 to reach an all-time high of $251.39 in July 2021. Worth noting the sectors comprising the ETF are on a growth trajectory worldwide thanks to digital transformation.
Here are the sector weightings of the ETF.
| Sector | Allocation |
| Technology | 42.68% |
| Communication Services | 30.87% |
| Consumer Cyclical | 20.35% |
| Healthcare | 3.14% |
| Financial Services | 2.96% |
In terms of regional specifics, the fund is purely concentrated in the US.
5. SPDR S&P Software & Services ETF (XSW)
SPDR S&P Software & Services ETF seeks to replicate the investment results of the S&P Software & Services Select Industry Index by investing at least 80% of its assets in the base index.
The fund was started on 29th September 2011 and currently has a market capitalisation of $299.04 million and an expense ratio of 0.35%.
Performance of the SPDR S&P Software & Services ETF Over The Last 5 Years.
From the chart, the fund’s NAV picked up steadily from 2020 to register positive gains as the pandemic relaxation measures took effect and the economy started showing early signs of recovery.
Indeed, the NAV was the highest at $184.44 in November 2021. We expect the same trend to continue through 2022 as the software and services sector is one of the most vibrant in the world.
Additionally, the ETF has invested in software companies such as game developers. Here is a list of top representations and their percentages.
Company | Percentage Weightings |
| Zynga Inc | 0.88 |
| Activision Blizzard Inc | 0.84 |
| Moneygram International Inc. | 0.83 |
| Citrix Systems, Inc. | 0.75 |
| WEX Inc | 0.74 |
| Fair, Isaac Corp. | 0.73 |
| NortonLifeLock Inc | 0.72 |
| Zendesk Inc | 0.72 |
| CDK Global Inc | 0.71 |
| Tenable Holdings Inc | 0.71 |
Here are the sector weightings of the ETF
| Sector | Weightings |
| Technology | 87.02% |
| Communication Services | 5.28% |
| Financial Services | 3.72% |
| Industrials | 3.38% |
| Consumer Cyclical | 0.6% |
Here is the geographical breakdown of the ETF
| Region | Spread |
| United States | 99.0% |
| Asia Emerging | 0.5% |
| Latin America | 0.5% |
6. iShares Global Tech ETF (IXN)
iShares Global Tech ETF (IXN) was started in 2001 and currently has up to $6 billion assets under its name. On top of that, it has an expense ratio of 0.43%. The ETF oscillates towards large capitalisation companies.
One unique thing about this fund is that it is diversified and includes global stocks. Therefore, it is a popular option for investors who prefer a mix of portfolios.
Other than that, the iShares Global Tech ETF tracks the performance of the Global 1200 Information Technology Sector Index that offers excellent exposure to software as well as hardware companies of the world.
Performance of the iShares Global Tech ETF Over The Last 5 Years
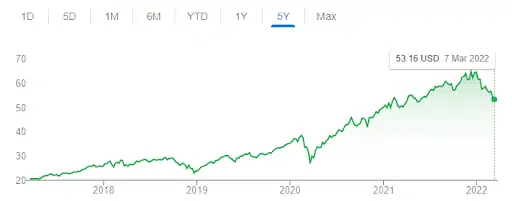
The fund’s NAV has been on a climb since 2020 to register an all-time high of $64.60 in November 2021.
Here are the top 10 companies making up the fund and their percentages.
| COMPANY | Allocation % |
| Apple Inc AAPL | 20.21 |
| Microsoft Corporation MSFT | 17.55 |
| NVIDIA Corp NVDA | 4.71 |
| Visa Inc | 2.72 |
| Mastercard Incorporated | 2.32 |
| Broadcom Inc AVGO | 1.88 |
| Cisco Systems, Inc. CSCO | 1.84 |
When it comes to sector allocation, the technology sector takes a bulk share.
| Sector | Weightings |
| Technology | 91.9% |
| Financial Services | 6.19% |
| Industrials | 1.63% |
| Consumer Cyclical | 0.24% |
| Communication Services | 0.04% |
Admittedly, the US holds a bulk of these US, constituting more than 75%.
However, tech giants such as Korea’s Samsung Electronics Co. Ltd and Taiwan’s Semiconductor Manufacturing Co.Ltd are big names in the iShares Global Tech ETF.
Therefore, this exposes you to major world tech companies.
Here is the geographical spread of this fund.
| Region | Spread |
| United States | 80.7% |
| Asia Developed | 8.1% |
| Euro Zone | 5.5% |
| Japan | 3.5% |
| Canada | 1.1% |
| Europe Ex Euro | 0.6% |
| Asia Emerging | 0.2% |
| UK | 0.2% |
| Australasia | 0.1% |
7. KraneShares CSI China Internet ETF (KWEB)
An interesting fact about the KraneShares CSI China Internet ETF (KWEB) is that it’s one of the largest ETFs out there with a market capitalisation of $8 billion. The current expense ratio of the fund is 0.7%.
The fund was launched in 2013 with the objective of providing investment results that correspond to the CSI Overseas China Internet Index. The underlying index measures the performance of publicly-traded internet-based companies in China.
In addition, the shares must be listed in a US-based stock exchange such as the NYSE and a local securities exchange like the Hong Kong Securities (HKEX).
Therefore, you’ll likely find an array of big names such as Baidu Inc, Alibaba Group Holding Ltd, and Tencent.
The list below represents the portfolio weight of the companies in the index.
| Company | Portfolio Weight |
| Tencent Holdings Ltd | 10.38% |
| Baidu Inc | 6.83% |
| Meituan | 6.61% |
| Alibaba Group Holding Ltd | 6.14% |
| JD.Com Inc | 5.26% |
| Trip.com Group Ltd | 4.58% |
| Kanzhun Ltd | 4.44% |
| KE Holdings Inc | 4.00% |
For industry specifics, here are the allocations under the KraneShares CSI China Internet ETF.
| Sector | Allocation |
| Communication Services | 38.45% |
| Consumer Cyclical | 35.20% |
| Technology | 7.10% |
| Healthcare | 5.96% |
| Industrials | 5.36% |
| Other | 8.16% |
Lastly, the fund’s bulk of investments goes to emerging Asia at 98.78% and Developed Asia at 1.46%.
On the whole, the KraneShares CSI China Internet ETF offers you a high growth potential at a low price.
However, there are risks that you should be aware of.
For example, political factors may be at play with the Chinese Government’s crackdown on the technology sectors. Funds like KWEBs which offer investment in internet-based companies are likely to suffer.
The fund is a bit risky since its performance depends on a specific industry coupled with political and economic factors.
Even though it’s riskier investing in a specific sub-sector, it’s not lost to thoughts that the top companies comprising the index are giants in their own ways.
Worth noting, these companies have registered high revenues and cash flow growth over the years. Additionally, the Chinese economy has been on a growth path thanks to high urbanisation rates as well as increased internet penetration.
Another thing that sets this fund apart is the relatively low price compared to the skyrocketing prices of US stocks. Therefore, there’s room for high returns amid favourable stock prices.
Read:
Conclusion
I hope you enjoyed reading my article on the best tech ETFs.
Each of these funds offers investors exposure to different sectors within the technology industry.
I’ve also discussed the pros and cons of each fund, as well as their past performances.
If you need help investing, many of our readers are flocking to get investing help from our partner financial advisors!