The TM Nest Egg (II) (FlexiSaver) plan is a participating endowment plan that provides consistent cash flow during the predetermined payout period.
With this plan, you can access your money without waiting until the policy term’s end for a lump sum payout, which behaves like an annuity plan!
For those concerned about potential future cash flow problems, the TM Nest Egg (II) (FlexiSaver) plan is here to provide financial security and ease your worries!
We have written a complete review of the TM Nest Egg (II) (FlexiSaver) plan to help you decide if it is the best policy you want to take up.
Criteria
- Minimum premium payment term: 5 years
- Minimum policy term: 15 years
- Maximum policy term: 30 years
- No medical underwriting required
General Features
Policy Terms
As the name ‘FlexiSaver’ goes, this plan is truly flexible in the breakdown of its policy terms. The policy term of this policy is split into 3 separate periods:
- Premium Payment Term – The period during which premium payments are made
- Accumulation Period – In the accumulation period, premium payments are no longer required, and Tokio Marine helps you to grow your savings (premiums paid)
- Payout Period – During the payout period, your accumulated premiums are slowly paid out to you every month
While a maximum commitment period of 30 years is imposed, you can design and build your plan according to your preferences as long as the total policy term does not exceed the 30-year limit.
| Period | Options |
| Premium Payment Term | 5 years, 10 years, or 15 years |
| Accumulation Period | 0 years – 10 years |
| Payout Period | 10 years, 15 years, or 20 years |
Premium Allocation
For those wondering how your money is managed or where your money goes, fret not!
The premiums paid for this participating policy go into a participating fund managed by Tokio Marine and their appointed external managers.
This participating fund comprises a mix of assets such as equities, fixed-income instruments, cash and other assets.
As of 31st December 2022, the strategic and actual breakdown of the participating fund is as such:
| Type of Assets | Strategic Allocation | Actual Allocation |
| Equities | 25% | 18% |
| Fixed Income | 72% | 78% |
| Cash and Other Assets | 3% | 4% |
| Total Assets | 100% | 100% |
Payout Options
Cash Benefit
With this plan, your payouts are reserved for the payout period at the end of your policy term, where you will receive it in the form of monthly cash benefits.
It is worth noting that the monthly cash benefits include a guaranteed monthly cash payout and a non-guaranteed monthly dividend, less any indebtedness.
At the point of application, you decide how much you want to receive in cash benefits, which will then determine the premiums required.
Maturity Benefit
When your policy reaches maturity, you will receive a lump sum payment, including the Cash Benefit and any accumulated interest accrued over time, less any indebtedness.
Surrender Benefit
However, if you require urgent cash flow before the policy matures, you can surrender your policy after paying 3 full years of premiums.
By doing so, Tokio Marine will payout a surrender benefit which includes a guaranteed surrender value and any cash benefit deposited with them, including interest.
Once you surrender your policy, it is deemed terminated.
However, opting for an early surrender will also involve early termination costs.
As such, I recommend you ensure you have sufficient liquid funds before committing to this policy to avoid being placed in this situation.
Protection
Death Benefit
If the insured passes away, the nominated beneficiary will receive a lump sum benefit comprising of the following, less any indebtedness:
- The higher of
- 101% of the total annual premiums paid for the basic plan, less all guaranteed monthly cash payouts that have previously been paid, or
- An amount equal to 12 guaranteed monthly cash payouts, plus
- A non-guaranteed terminal dividend; and
- Any cash benefits deposited with Tokio Marine plus interest
After which, the policy will be deemed terminated.
Terminal Illness Benefit
A terminal illness (TI) is deemed as a conclusive diagnosis of the life assured with an illness that may result in their passing within the next 12 months.
If the insured is diagnosed with a TI while the policy is active, you will receive the death benefit up to the TI Limit of $4,500,000, minus any outstanding debts.
Any additional amount beyond the TI Limit will be disbursed to you as subsequent insured events occur.
However, note that the sum assured decreases upon payment of the TI Benefit.
If the sum assured reaches zero, you be deemed to have received the full policy benefit, and the policy will terminate.
Policy Add-ons
While this policy is not built for those looking for comprehensive protection, you can still enhance your coverage with a selection of add-ons known as Riders.
For those who wish to maximise your coverage, you may want to choose from a selection of add-ons such as the Cancer Waiver Rider, Payer Benefit Rider, Spouse Rider, Waiver of Premium Rider, and Early Critical Illness Premium Waiver Rider.
Key Features
Dividend Payouts
In this policy, there are 2 types of dividends involved: Monthly Dividends and Terminal Dividends.
Monthly Dividends
With this policy, you can expect a steady stream of monthly dividend payments to form part of the Cash Benefit payable.
The monthly dividend rate is non-guaranteed. However, based on an illustrated Investment Rate of Return (IRR) of 4.25% p.a. for the different payout periods can be found below.
10-year Payout Period
| Accumulation Period | Monthly Dividend Rate as % of Guaranteed Monthly Cash Payout | ||
| Premium Term 5 | Premium Term 10 | Premium Term 15 | |
| 0 | 19.6% | 29.5% | 43.0% |
| 1 | 24.9% | 35.0% | 48.8% |
| 2 | 30.2% | 40.5% | 54.6% |
| 3 | 35.5% | 46.0% | 60.4% |
| 4 | 40.6% | 51.5% | 66.2% |
| 5 | 45.8% | 57.4% | 72.0% |
| 6 | 51.6% | 63.9% | – |
| 7 | 57.5% | 70.4% | – |
| 8 | 63.2% | 76.9% | – |
| 9 | 69.0% | 83.4% | – |
| 10 | 75.8% | 90.3% | – |
15-year Payout Period
| Accumulation Period | Monthly Dividend Rate as % of Guaranteed Monthly Cash Payout | ||
| Premium Term 5 | Premium Term 10 | Premium Term 15 | |
| 0 | 29.0% | 41.2% | 54.0% |
| 1 | 35.7% | 47.0% | – |
| 2 | 41.4% | 52.8% | – |
| 3 | 47.1% | 58.6% | – |
| 4 | 52.3% | 64.4% | – |
| 5 | 57.6% | 70.5% | – |
| 6 | 66.7% | – | – |
| 7 | 73.7% | – | – |
| 8 | 80.7% | – | – |
| 9 | 87.7% | – | – |
| 10 | 94.8% | – | – |
20-year Payout Period
| Accumulation Period | Monthly Dividend Rate as % of Guaranteed Monthly Cash Payout | ||
| Premium Term 5 | Premium Term 10 | Premium Term 15 | |
| 0 | 38.1% | 51.6% | – |
| 1 | 46.4% | – | – |
| 2 | 52.6% | – | – |
| 3 | 58.8% | – | – |
| 4 | 65.0% | – | – |
| 5 | 71.5% | – | – |
Terminal Dividend
The terminal dividend is a one-time payment upon the death of the insured.
The terminal dividend rate based on an illustrated Investment Rate of Return (IRR) of 4.25% p.a. for the different payout periods can be found below.
10-year Payout Period
| Accumulation Period | Monthly Dividend Rate as % of Guaranteed Monthly Cash Payout | ||
| Premium Term 5 | Premium Term 10 | Premium Term 15 | |
| 0 | 235.2% | 354.0% | 516.0% |
| 1 | 298.8% | 420.0% | 585.6% |
| 2 | 362.4% | 486.0% | 655.2% |
| 3 | 426.0% | 552.0% | 724.8% |
| 4 | 487.2% | 618.0% | 794.4% |
| 5 | 549.6% | 688.8% | 864.0% |
| 6 | 619.2% | 766.8% | – |
| 7 | 690.0% | 844.8% | – |
| 8 | 758.4% | 922.8% | – |
| 9 | 828.0% | 1,000.8% | – |
| 10 | 909.6% | 1,083.6% | – |
15-year Payout Period
| Accumulation Period | Monthly Dividend Rate as % of Guaranteed Monthly Cash Payout | ||
| Premium Term 5 | Premium Term 10 | Premium Term 15 | |
| 0 | 348.0% | 494.4% | 648.0% |
| 1 | 428.4% | 564.0% | – |
| 2 | 496.8% | 633.6% | – |
| 3 | 565.2% | 703.2% | – |
| 4 | 627.6% | 772.8% | – |
| 5 | 691.2% | 846.0% | – |
| 6 | 800.4% | – | – |
| 7 | 884.4% | – | – |
| 8 | 968.4% | – | – |
| 9 | 1,052.4% | – | – |
| 10 | 1,137.6% | – | – |
20-year Payout Period
| Accumulation Period | Monthly Dividend Rate as % of Guaranteed Monthly Cash Payout | ||
| Premium Term 5 | Premium Term 10 | Premium Term 15 | |
| 0 | 457.2% | 619.2% | – |
| 1 | 556.8% | – | – |
| 2 | 631.2% | – | – |
| 3 | 705.6% | – | – |
| 4 | 780.0% | – | – |
| 5 | 858.0% | – | – |
However, potential or existing policyholders should note that these dividend payments are not guaranteed and may fluctuate based on the fund’s actual performance.
Participating Fund Performance
Asset Allocation
If you’re considering placing your money into an endowment or annuity plan, assessing how the par fund is performing is important.
To give you the rundown, let’s take a peek at the asset allocation of the participating fund as of 31st December 2021.
| Type of Assets | Strategic Allocation | Actual Allocation |
| Equities | 30% | 19% |
| Fixed Income | 67% | 75% |
| Cash & Other Assets | 3% | 6% |
| Total | 100% | 100% |
Past Investment Rate of Return
As of 31st December 2021, this is how the par funds have performed:
| 2019 | 2020 | 2021 | Average of Last | |||
| 3 Years | 5 Years | 10 Years | ||||
| Investment Returns | 9.69% | – 4.92% | – 13.94% | – 3.54% | – 0.22% | 2.10% |
While the average returns over the past few years were not ideal, this can be attributed to the fact that the pandemic heavily impacted those years.
Looking at the investment returns in 2019 and over the last 10 years, we can see that the par fund still performs at 9.69% p.a. and 2.10% p.a. respectively, which is not bad.
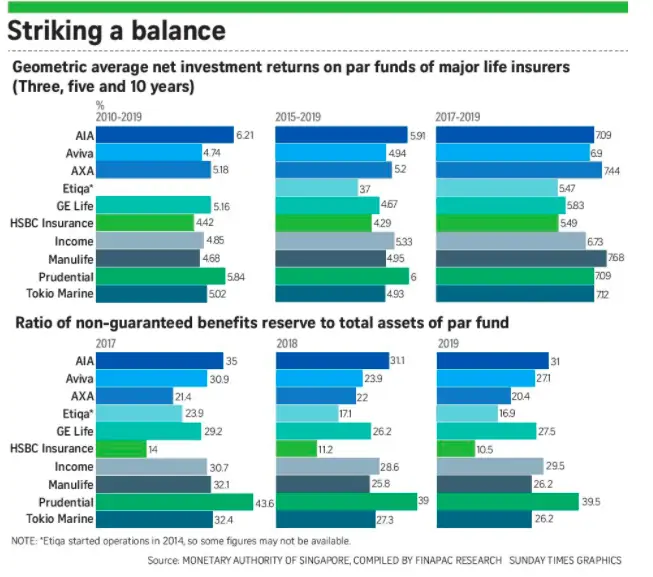
In fact, the geometric net investment returns of par funds across life insurers in Singapore have been tabulated below for your reference:

From this data, I must point out that Tokio Marine stands out quite well!
Past Total Expense Ratio
As you explore investing in different par funds, it’s vital to take a close look at their total expense ratio.
After all, the expenses associated with managing these investments directly impact your potential returns.
The following table shows the past total expense ratios for the participating fund:
| 2019 | 2020 | 2021 | Average of Last | |||
| 3 Years | 5 Years | 10 Years | ||||
| Total Expense Ratio | 0.74% | 0.63% | 0.58% | 0.65% | 0.84% | 1.64% |
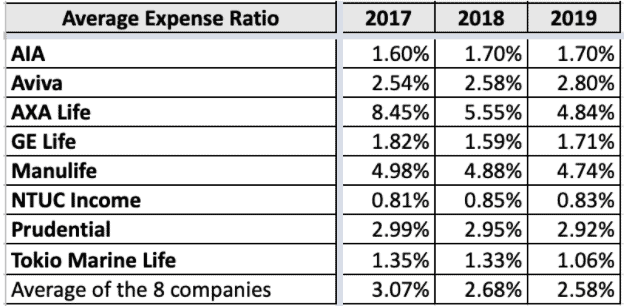
Well, the numbers might not mean much, but comparing them to others definitely will. That’s why I’ve got this handy table for you:

As you can see, Tokio Marine Life has the 2nd lowest average expense ratio, just after NTUC Income.
TM Nest Egg (II) (FlexiSaver) Fees And Charges
All the fees and charges have already been factored into the premiums you’ll pay for TM Nest Egg (II) (FlexiSaver).
This means there will be no surprise charges or extra expenses to catch you off-guard.
An Illustration of How the TM Nest Egg (II) (FlexiSaver) Works
Introducing John, a 50-year-old man passionate about securing his financial future.
John is a non-smoker and has the foresight to plan for additional income by investing in the TM Nest Egg (II) (FlexiSaver) policy.
He thoroughly weighs his options and decides on paying an annual premium of $11,700 for 10 years, with no accumulation period and a long payout period of 20 years.
At the age of 60, John will start reaping the benefits of his investment, receiving a guaranteed payout of $500 every month, which will continue until his 80th birthday.
With this financial move, John is setting himself up for a comfortable and secure future.
| Policy Year | John’s Age | Sequence of Events |
| 0 | 50 years old | John purchases the policy and starts premium payments of $11,700 p.a. |
| 10 | 60 years old | Total Premiums Paid = $117,000 |
| Begins to receive monthly cash benefits:
Guaranteed Monthly Cash Benefits = $500 Non-guaranteed Monthly Cash Benefits = $258 |
||
| 30 | 80 years old | End of payout period |
| Total monthly cash benefits received by the end of the payout period:
Total Guaranteed Monthly Cash Benefits = $120,000 Total Non-guaranteed Monthly Cash Benefits = $61,920 |
||
From the table, it’s worth noting that the cumulative payout over 2 decades amounted to a substantial sum of $181,920 at an illustrated 4.25% rate of return.
Therefore John’s investment resulted in an annualised return of 2.96%.
Summary of the TM Nest Egg (II) (FlexiSaver)
| Cash & Cash Withdrawal Benefits | |
| Cash Value | Available |
| Cash Withdrawals | Available |
| Health & Insurance Coverage | |
| Death | Available |
| TPD | N/A |
| Terminal Illness | Available |
| Critical Illness | N/A |
| Early Critical Illness | N/A |
| Health & Insurance Coverage Multiplier | |
| Death | N/A |
| TPD | N/A |
| Terminal Illness | N/A |
| Critical Illness | N/A |
| Early Critical Illness | N/A |
| Additional Benefits | |
| Optional Add-on Riders | Available |
My Review of the TM Nest Egg (II) (FlexiSaver)
With the TM Nest Egg (II) (FlexiSaver) policy, you can enjoy the best of both worlds – steady income and increased returns!
You get to choose when and how much cash payout is delivered, all while benefitting from guaranteed and non-guaranteed dividends that can be re-invested for higher benefits.
Plus, various additional features like coverage against death or terminal illness and optional riders provide greater protection with premium waivers in cases of critical illness diagnosis.
It all adds to an unbeatable financial plan tailored just to your needs.
However, be mindful that this policy can only provide you with fundamental protection, considering it focuses on helping you grow your savings.
If you are considering getting a comprehensive protection plan, you may wish to consider other types of plans (perhaps a term policy or a whole life plan) that better suit your preferences.
It also lacks flexibility like the Manulife RetireReady Plus III (an annuity plan)– but given this is an endowment plan first, it’s not the best comparison.
In its own category, I’d say it definitely is one of the better ones I’ve seen.
With that said, when selecting an insurance policy, don’t settle for “just okay.” Be sure to compare different policies and providers to find the right fit!
Here’s our comparison of annuity plans in Singapore, and here’s our comparison of endowment plans.
Should you need more advice, talk to one of our financial advisors and carefully consider all your options.


