
Gold is the ultimate safe-haven investment and has been a popular asset class for centuries.
This is especially true recently due to the increasing inflation faced by investors.
However, it’s not always easy to find the right gold ETF that fits your investing style.
Should you invest in gold companies or physical gold?
To help you make an informed decision, we’ve put together this list of the top gold ETFs available today.
7 Best Gold ETFs
- SPDR Gold Shares ETF
- Aberdeen Standard Physical Gold Shares ETF
- iShares Gold Trust
- SPD Gold Minishares Trust
- GraniteShares Gold Trust
- Global X Gold Explorers ETF
- ProShares Ultra Gold ETF
| ETF | Ticker | Current NAV | Expense Ratio | Market Cap | Issuer | Launch Date |
| SPDR Gold Shares ETF | O87 | $180.65 | 0.40% | $65,838.28 M | World Gold Trust Services | November 18, 2004 |
| Aberdeen Standard Physical Gold Shares ETF | SGOL | $18.51 | 0.17% | $2.39 billion | Aberdeen Standard Investments | September 9, 2009 |
| iShares Gold Trust | IAU | $36.65 | 0.25% | $2.62 billion | Goldman Sachs | January 21, 2005 |
| SPDR Gold Minishares Trust | GLDM | $38.33 | 0.18% | $4.36billion | World Gold Council | June 25, 2018 |
| GraniteShares Gold Trust | BAR | $19.12 | 0.17% | $912.01 million | GraniteShares | August 31, 2017 |
| Global X Gold Explorers ETF | GOEX | $31.59 | 0.65% | $46.81 million | Global X Funds | November 3, 2010 |
| ProShares Ultra Gold | UGL | $65.72 | 0.95% | $232.79 | ProShares | December 1, 2008 |
1. SPDR Gold Shares ETF (SGX:O87)
The SPDR Gold Shares ETF was founded on 18th November 2004 and currently has an expense ratio of 0.40%. It’s domiciled in the US, however, the countries of registration include Singapore, the US, and Hong Kong.
The SPDR Gold Shares fund offers you an opportunity to take part in the gold bullion market. The SPDR Gold Share main attributes include:
- It’s readily available on the Singapore Stock Exchange
- The main custodian of the Gold shares is the HSBC Bank PLC.
- The transaction costs are lower compared to purchasing, storing, and insuring physical gold.
- The process of tracking the NAV, holdings, and market capitalisation is transparent via the spdrgoldshares.com website.
- You can trade the gold shares just like you would do with ordinary shares in either USD or SGD currencies.
Other than that, the SPDR Gold Shares are held in SPDR Gold Trust which was established under the New York Law.
The main objective of the Gold Trust is for the Shares to reflect the performance of the gold bullion NAV minus the Trust’s expenses.
The shares are traded on the Singapore Securities Exchange (SGX-ST), NYSE Arca, Inc, and the Stock Exchange of Hong Kong Limited (SEHK).
It’s also worth noting that this is the first gold ETF that you can purchase with SGD under the code GSD.
SPDR Gold Shares 5-Year Performance
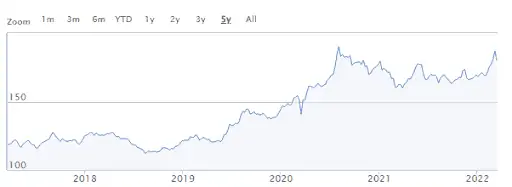
The current NAV of SPDR Gold Shares ETF stands at $180.65 to deliver a market capitalisation of $65,838.28M.
Looking at the chart, the price has risen steadily and in March 2022, it reached an all-time high of $189.11.
Price Return of SPDR Gold Shares Against the Benchmark
The performance of the fund has closely matched that of the benchmark since inception as shown in the table below.
| Returns | SPDR Gold Shares | Benchmark |
| 1-year | 9.14% | 9.58% |
| 3-year | 12.67% | 13.11% |
| 5-year | 8.31% | 8.75% |
| 10-year | 0.36% | 0.76% |
From 20th March 2015, SPDR Gold Trust adopted LBMA Gold Price PM as the base benchmark in tracking the performance of the NAV. Before that, the London PM Fix was the underlying benchmark.
2. Aberdeen Standard Physical Gold Shares ETF (NYSEARCA:SGOL)
Aberdeen Standard Physical Gold Shares ETF is under the management of Aberdeen Standard Investments ETFs Sponsor LLC. Its main objective is to invest in commodity markets, primarily gold.
The ETF seeks to track the price and performance of gold bullion minus expenses.
It was launched on 1st September 2009 and is currently domiciled in the US. Additionally, the fund has gold bullion reserves held in physical vaults in the UK and Switzerland.
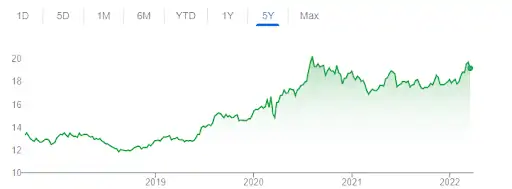
Aberdeen Standard Physical Gold Shares 5-Year Performance
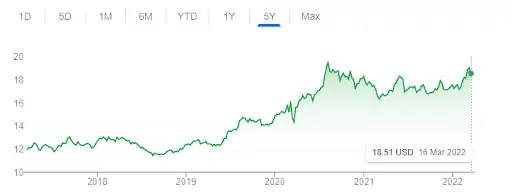
The current NAV stands at $18.51 to deliver a market capitalisation of $2.39 billion. The expense ratio is 0.17% which translates to an expense of $17 for every $10,000 invested.
The price has been rising over the years to register an all-time high of $18.99 in August 2020. As you can see, the price continued to climb even during the pandemic from 2020.
Price Return of Aberdeen Standard Physical Gold Shares Against the Benchmark
| Returns | Aberdeen Standard Physical Gold Shares | Benchmark |
| 1-year | -4.47% | -4.33% |
| 3-year | 11.99% | 12.15% |
| 5-year | 9.23% | 9.51% |
| 10-year | 1.33% | 1.66% |
The benchmark is London PM fix for Gold.
The fund has registered positive returns over a 10-year period when compared to the benchmark.
The performance of the SGOL is closely matching the benchmark mainly due to favourable expense ratio which is among the lowest.
3. iShares Gold Trust (NYSEARCA:IAU)
The investment objective of the iShares Gold trust seeks to reflect the performance of the price of gold. It tracks the price of gold minus expenses and uses the value of gold bars held in multiple vaults around the gold.
The fund was launched on 21st January 2005 to allow investors to escape the logistics associated with holding physical gold.
The primary exchange for the ETF is NYSE Arca which uses a Grantor Trust structure. Because of this, the ETF is very stable and a great choice if you are looking for gold investments.
iShares Gold Trust 5-Year Performance
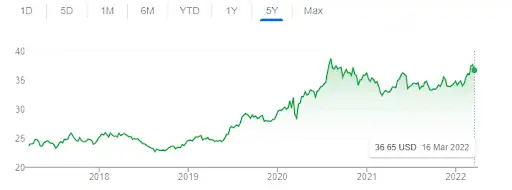
The iShares Gold Trust NAV is currently at $36.65 to deliver a market capitalisation of $2.62 billion.
The expense ratio is 0.25% which means every year you’ll incur $25 per $10,000 worth of investment.
The main reason you should invest in IAU is to diversify your portfolio since like other gold funds, it offers a hedge against inflation.
Price Return of iShares Gold Trust Against the Benchmark
The fund’s NAV has been consistent against the underlying benchmark as shown in the table below.
| Returns | iShares Gold Trust | Benchmark |
| 1-year | -3.99% | 9.58% |
| 3-year | 12.12% | 13.11% |
| 5-year | 9.18% | 8.75% |
| 10-year | 1.49% | 0.76% |
Note that like other funds in our discussion, the iShares Gold Trust ETF uses the LBMA Gold Price as the reference benchmark.
4. SPDR Gold Minishares Trust (NYSEARCA:GLDM)
The SPDR Gold Minishares Trust was formed to track the price of gold minus expenses and liabilities. The trust holds gold bullion bars in a vault in London.
The fund was launched on 25th June 2018 by the World Gold Council. The primary exchange is NYSE Arca and uses a Grantor Trust structure.
SPDR Gold Minishares Trust 5-Year Performance
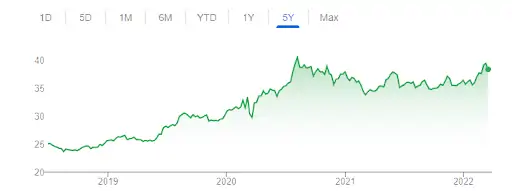
The current NAV for the fund is $38.33 to deliver a market capitalisation of $4.36billion. In the last year, the fund has had an impressive climb to reach $39.39 on 7th March 2022.
The fund offers one of the lowest expense ratios at 0.18% which means investors are spending $18 per $10,000 investment. Therefore, it’s an excellent choice for investors intending to have prolonged exposure to gold.
Price Return of SPDR Gold Minishares Trust Against the Benchmark
| Returns | SPDR Gold Minishares Trust | Benchmark |
| 1-year | -0.84% | 9.58% |
| 3-year | 12.03% | 13.11% |
| 5-year | N/A | 8.75% |
| 10-year | N/A | 0.76% |
Even though the fund has been around for a short time, it has held steady against the benchmark in its three-year performance.
As an investor, you shouldn’t be worried about the negative 1-year performance because it can generally fluctuate in a short period of time. However, historically, gold assets have provided a stable store of value.
5. GraniteShares Gold Trust (BAR)
The GraniteShares Gold Trust ETF seeks for the value of the shares to correspond to the price of gold held in the vaults by the Trust minus expenses and liabilities.
GraniteShares Gold Trust was launched on 31st August 2017 to offer a convenient way to access the gold market. The GraniteShares Gold Trust has a Grantor Trust structure, which may offer tax protection for investors.
You also get a chance to enjoy a lower total cost of investment over longer periods of time. With an expense ratio of 0.17%, it’s one of the lowest on the market.
One of the key highlights of this ETF is that the Trust holds LBMA-good delivery bars in a London-domiciled vault. In addition, the Trust publishes the list of gold bars in its vault for investors and the general public.
To enhance transparency, there is an audit conducted semi-annually to ensure it has a verifiable amount of gold in its vaults.
GraniteShares Gold Trust 5-Year Performance
Looking at the chart, the current NAV is $19.12 which puts the market capitalisation at $912.01 million. That’s an impressive figure bearing in mind, the fund has only been around for 3 years.
Price Return of GraniteShares Gold Trust Against the Benchmark
| Returns | GraniteShares Gold Trust (BAR) | Benchmark |
| 1-year | -0.85% | 9.58% |
| 3-year | 12.00% | 13.11% |
| 5-year | N/a | 8.75% |
| 10-year | N/a | 0.76% |
The highest possible NAV of $20.20 was recorded on 7th August 2020.
6. Global X Gold Explorers ETF (GOEX)
The Global X Gold Explorers ETF seeks to track generally the investment results of Solactive Global Gold Explorers & Developers Total Return Index before expenses.
In a single trade, the ETF delivers easy access to companies involved in gold exploration.
The ETF was founded on 3rd November 2010 and currently operates an expense ratio of 0.65%.
Even if the cost is higher than most ETFs in our review, it’s still pretty acceptable.
Global X Gold Explorers 5-Year Performance
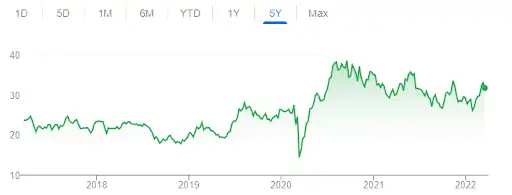
The NAV is at $31.59 to deliver a market capitalisation of $46.81 million. As you can see the fund registered a drop in its price in 2020 mainly due to the effect of the pandemic.
However, it withered the storm to register impressive gains reaching a high of $38.28 on 7th August 2020.
Price Return of Global X Gold Explorers ETF Against the Benchmark
| Returns | Global X Gold Explorers ETF | Benchmark |
| 1-year | -14.25% | -13.77% |
| 3-year | 16.20% | 16.82% |
| 5-year | 8.43% | 9.03% |
| 10-year | -4.87% | -4.04% |
Note that the benchmark is the Solactive Global Gold Explorers & Developers Total Return Index.
Top Holdings
Here are the top 10 companies comprising the fund.
| Name | % Assets |
| Hecla Mining Co | 6.82% |
| Kirkland Lake Gold Ltd | 4.31% |
| SSR Mining Inc | 4.06% |
| Endeavour Mining PLC | 3.94% |
| PT Merdeka Copper Gold Tbk | 3.84% |
| Alamos Gold Inc Class A | 3.67% |
| B2Gold Corp | 3.50% |
| Coeur Mining Inc | 3.38% |
| Novagold Resources Inc | 3.35% |
| Equinox Gold Corp | 3.16% |
For sector breakdown, the ETF has invested 98% of its funds in the Materials sector and 2% in Information Technology.
The last announced dividend for the fund was $0.54 with a 2.17% dividend yield over a 12-month trailing period.
7. ProShares Ultra Gold (UGL)
ProShares Ultra Gold ETF seeks to track investment results that replicate to 2x the daily performance of the Bloomberg Gold SubindexSM Index. The ETF’s objective is to invest under standard market conditions in financial instruments based on the benchmark.
Worth noting, the Bloomberg Gold SubindexSM is a sub-index of the Bloomberg Commodity Index whose objective is to reflect the investment results of gold as estimated by the price of COMEX gold futures contracts.
Essentially, it’s a rolling index that does not hold physical gold.
The ProShares fund was launched on 1st December 2008 and currently operates at an expense ratio is 0.95%
In the fund, you invest in gold shares at a low cost just like you would in physical gold, but with fewer logistics to deal with.
ProShares Ultra Gold 5-Year Performance
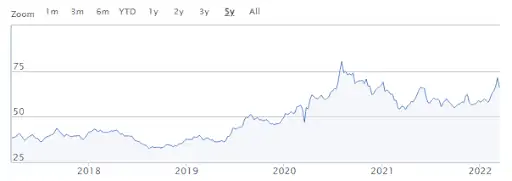
The NAV currently is at $65.72 to deliver a market capitalisation of $232.79 million. There has been a steady climb over the years.
Price Return of Global X Gold Explorers ETF Against the Bloomberg Commodity Index
| Returns | ProShares Ultra Gold (UGL) | Benchmark |
| 1-year | -11.67% | -4.28% |
| 3-year | 16.10% | – |
| 5-year | 12.65% | 8.41% |
| 10-year | -2.37% | 0.68% |
The benchmark is Bloomberg Gold SubIndex.
The fund has registered positive returns over a 3-year and 5-year period.
Top Holdings
There are top 4 holdings for the fund as shown in the table below.
| Name | % Assets |
| Gold 100 Oz Futr Aug21 | 70.73% |
| Bloomberg Gold Subindex Swap – Ubs Ag | 46.30% |
| Bloomberg Gold Subindex Swap – Citibank Na | 44.51% |
| Bloomberg Gold Subindex Swap – Goldman Sachs | 38.47% |
Conclusion
Gold is a safe haven asset, meaning that its value will increase when other assets decrease.
This makes it a good investment for people who want to preserve their wealth during times of economic uncertainty.
It also means that if there is a global recession or depression, then gold prices should rise – explaining why the prices have been increasing since the start of the pandemic.
Looking to purchase these ETFs?
Choose the best broker account for yourself and get investing!
Need someone to help you invest instead?
We partner with unbiased financial advisors to help you with this.