
Heard many things about the ARKK and ARKW?
Not sure which to invest in, or whether you should consider investing in them at all?
Want to know what’s the difference between them?
You’ve come to the right place.
Here’s a comparison between ARKK and ARKW.
Read on.
| ETF | ARKK | ARKW |
| Issuer | ARK | ARK |
| Current NAV | $65.67 | $86.72 |
| Inception Date | 31st October 2014 | 29th September 2014 |
| Legal Structure | Open-end fund | Open-end fund |
| Expense Ratio | 0.75% | 0.83% |
| Weighted Market Capitalisation | $113 Billion | $147 Billion |
| Average Spread | 0.03% | 0.05% |
| P/E Ratio | -35.32 | 24.31 |
| P/B Ratio | 3.64 | 2.97 |
| Distribution Yield | 1.17% | 3.77% |
| Total Holdings | 42 | 42 |
| Underlying Index | Not available | Not available |
Key Highlights as of 28 March 2022
About
Both funds are under ARK Invest, whose foundation lies in the disruptive innovation approach that focuses on fast-growing firms in the next-gen technologies.
Additionally, the company considers firms in the fintech space on an upward trajectory due to emerging opportunities such as cryptocurrencies and blockchain.
ARKK is an actively managed ETF seeking sustained capital growth by investing at least 65% of its assets from global companies whose innovation brings change.
Some of these companies are cutting-edge organisations with massive investments in disruptive innovation.
These include companies that benefit from technological advancements such as;
- Genomic Revolution
- DNA Technologies
- Fintech Innovation
- Artificial Intelligence
- Next Generation Internet
- Automation, Robotics
- Energy Storage
The objective of the ARKW ETF is to invest in companies that fund managers believe will benefit from cloud and mobile technologies, rather than traditional hardware or software.
The ARKW mandate is not limited by the geographical spread or industry. The fund managers identify firms that are more inclined to internet evolution, such as;
- Internet of Things(IoT)
- Cloud computing,
- Wearable technology
- Digital currencies or cryptos
As an investor, this can be appealing because these companies are the drivers of the world economy as we advance into the future.
For an investor looking to invest in these ETFs, you may have 2 options, to consider the ARKK, which uses a broader or diversified scope, or ARKW, which uses a targeted approach.
In terms of age, both funds have been around for around 7 years. However, they have witnessed market conditions such as the market crash of 2020 when stock prices suddenly dropped due to instability caused by the COVID-19 pandemic.
Market Capitalisation
The ARKK NAV as of 25th March 2022 stands at $64.52 to deliver a market capitalisation of $113 billion.
On the other hand, NAV for ARKW currently stands at $85.28 to deliver a market capitalisation of $147 billion.
ARKK vs ARKW: Expense Ratio
The ARKK and ARKW have an expense ratio of 0.75% and 0.83% p.a respectively.
With ETFs at these expense ratios, they’re definitely on the high as compared to ETFs like VOO and QQQ.
This is especially true since both these ETFs are active ETFs, which requires the fund manager to actively manage it to improve returns, while VOO and QQQ are passive ETFs.
Even though the difference of 0.08% may appear insignificant, the difference may be significant while considering a future outlook.
However, as long as the fund manager can generate much higher returns than your typical passive ETFs, this shouldn’t matter!
ARKK vs ARKW: Historial Returns
Both funds have delivered remarkable success since inception especially because of the internet revolution.
| YTD | 1 Year | 3 Years | 5 Years | Since Inception | |
| ARKK | -29.20% | -23.36% | 37.81% | 38.41% | 25.85% |
| ARKW | -16.65% | -16.65% | 42.76% | 41.61% | 31.51% |
| S&P500 | 28.71% | 28.71% | 26.07% | 18.47% | 15.10% |
| MSCI World Index(M1WO) | 21.82% | 28.82% | 21.70% | 15.03% | 11.46% |
The performance of both ETFs is compared against the S&P Index, which is a globally acclaimed capitalisation index that estimates the performance of large-cap in the US stock market.
On the other hand, the MSCI Index represents both mid and large-cap equity performance in developed markets.
From the figures, both ARKK and ARKW have performed better than both indexes in longer timeframes and since inception.
Comparing the performance of both ETFs
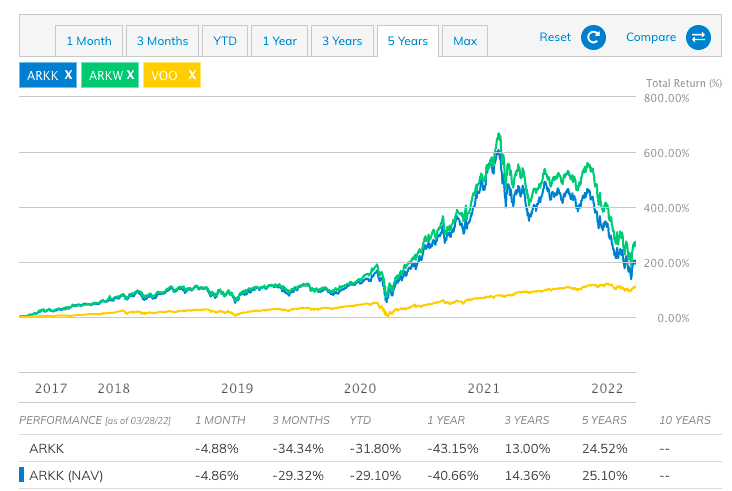
By comparing the 2 funds, ARKW has clearly outperformed the ARKK and looking at the historical performance, it’s the champ here.
Looking at both funds, you can see that the fund dropped a bit in 2020 due to the market crash that occurred in March 2020 in the face of the COVID-19 pandemic.
However, the NAV for ARKK rose steadily to register an incredible all-time high of $156.58 on 12th February 2021.
On the other hand, ARKW registered an all-time high of $187.47 on 12th February 2021.
The returns are net of the funds’ expenses.
ARKW vs ARKK: Holdings
One of the most distinguishing factors between the 2 ETFs is the technology distribution. Whereas ARKK is broad-based and includes a diversified list of emerging technologies, ARKW is more focused on internet-based technologies.
Technology Distribution
| ARKK Technology Breakdown | Percentage | ARKW Technology Breakdown | Percentage |
| Cloud Computing | 15.0% | Digital Media | 17.4% |
| Digital Media | 12.0% | Cloud Computing | 16.3% |
| E-Commerce | 7.41% | Blockchain & P2P | 14.7% |
| Gene Therapy | 6.7% | E-Commerce | 12.8% |
| Instrumentation | 5.4% | Big Data & Machine Learning | 12.1% |
| Big Data & Machine Learning | 5.3% | Internet of Things | 10.0% |
| Blockchain & P2P | 5.0% | Social Platforms | 8.5% |
| Mobile | 5.0% | Mobile | 8.2% |
| Internet of Things | 4.8% | – | |
| Bioinformatics | 4.7% | ||
| Next-Generation Oncology | 4.3% | ||
| Molecular Diagnostics | 4.0% | ||
| Robotics | 3.9% | ||
| Autonomous Vehicles | 2.7% | ||
| Social Platforms | 2.6% | ||
| Energy Storage | 2.6% | ||
| Beyond DNA | 2.2% | ||
| Development of Infrastructure | 1.6% | ||
| Targeted Therapeutics | 1.6% | ||
| Space Exploration | 1.5% | ||
| 3D Printing | 1.2% | ||
Top Company Holdings
An important thing to note is that the companies under ARKK and ARKW have somehow overlapped thanks to the investment objectives of ARK.
Therefore as expected, both funds invest heavily in stocks of tech-related companies. However, the percentage distributions may differ.
The portfolio distribution of the companies under ARKK includes firms dealing in artificial intelligence, automation, energy, genomics, transportation, shared materials, and infrastructure.
Here is a summary of their top holdings.
| Company | ARKK Weightings | Company | ARKW Weightings |
| Tesla | 10.45% | Tesla | 9.07% |
| Teladoc Health | 6.64% | Coinbase Global | 8.50% |
| Roku | 6.28% | Grayscale Bitcoin Trust | 7.41% |
| Zoom | 6.15% | Block | 6.69% |
| Block | 5.93% | Roku | 5.73% |
| Coinbase Global | 5.71% | Zoom | 5.54% |
| Exact Sciences Corporation | 4.72% | Teladoc Health | 5.34% |
| Unity Software | 4.71% | Twilio | 4.70% |
| Twilio | 4.18% | Spotify | 4.30% |
| UiPath | 3.99% | Shopify | 4.01% |
| Total | 58.76% | Total | 61.38% |
From the figures, the top 10 portfolios constitute 61.38% of ARKW and 58.76% of ARKK.
It may seem like an odd percentage distribution, especially for the top 10 holdings; nonetheless, it’s worth noting that the funds are mostly leaning towards disruptive innovation firms, unlike the more diversified global index fund.
If we further break down the sectors, you will see an overall of the industries where the ETFs choose to invest.
ARKK has a heavier weighting, with the majority of its total assets invested in mid and small-cap stocks.
Both ARKK and ARKW have invested heavily in IT and communication services.
| ARKK Sector Breakdown | Percentage |
| Information Technology | 33.2% |
| Healthcare | 32.2% |
| Communication Services | 15.8% |
| Consumer Discretionary | 10.7% |
| Financials | 6.5% |
| Industrials | 1.5% |
| Classified | 0.1% |
As you can see in the table below, ARKK has invested more in the Healthcare sector at 32.2%. The main reason is that the modern Health Industry is leaning toward bioinformatics, digital diagnosis, molecular diagnostics, and gene therapy.
The financial services sector takes about 6.5% of the sector allocation of ARKK, and here you’ll find big names in the fintech and crypto industry such as Lending Club, Coinbase, and Silvergate Capital.
| ARKW Sector Breakdown | Percentage |
| Information Technology | 34.9% |
| Communication Services | 26.3% |
| Consumer Discretionary | 16.6% |
| Financials | 8.6% |
| Not Classified | 7.4% |
| Healthcare | 6.2% |
Communication Services takes a big chunk of ARKW sector breakdown with the distribution covering Digital Media, Cloud Computing, Blockchain & P2P, E-Commerce, IoT, Social Media, and Mobile.
Geographical Spread
In terms of geographical spread, the 2 dedicate most of their investments to U.S. stocks.
However, ARKW has more diversity including the emerging markets, which is expected because fintech solutions and bitcoin payments are on an upward trajectory in Asian markets.
ARKK’s geographical distribution includes; USA 99.32%. Singapore 0.08% and Belgium 0.60%.
On the other hand, the geographical distribution of ARKW includes; The USA 95.80%, Singapore 2.10%, Israel 1.16%, and Netherlands 0.94%.
MSCI ESG Fund Rating
The MSCI ESG Fund Rating gauges how portfolios are performing against risks, opportunities, social, economic, political, and governance factors.
This is one of the important criteria to look at if you’re ESG investing.
The best rating is AAA, whereas the worst is CCC.
ARKK has an MSCI ESG Fund Rating of A based on a score of 6.50 out of 10.
On the other hand, ARKW has an MSCI ESG Fund Rating of BBB based on a score of 5.7 out of 10.
Conclusion
To sum it off, ARKW has a higher expense ratio of 0.83%, is less diversified, but has better 5-year annualised returns of 41.61%.
ARKK has a lower expense ratio of 0.75%, is more diversified, but has lower 5-year annualised returns of 38.41%.
If you’re comparing returns, ARKW wins hands-down – based on historical performance.
But ARKK is more diversified into other developing technologies that ARKW isn’t, which means that you’re leaving the opportunity to be early investors.
Due to the lack of diversification as well, ARKW is more volatile than ARKK, if you’re not one to stomach large fluctuations.
In fact, if you’re looking for something more diversified, both ARKW and ARKK are relatively non-diversified as it focuses on innovative companies, of which many are currently in the US markets.
Here are the alternative best tech ETFs for you to consider.
Ultimately, the choice between them is up to you.
I hope this post helps differentiate between ARKW and ARKK!
You can get them via a brokerage account, of which Syfe Trade is the cheapest for US markets!
Open an account with Syfe Trade here.